Mobias improves road safety with Swarmnect

One key aspect of achieving Vision Zero is the utilization of connected vehicle features to enhance the driver's awareness of their surroundings. This encompasses cooperative driving assistance features and autonomous hazard warnings. However, the sheer volume of data and the abundance of hazard signals generated by vehicles require refinement to extract meaningful insights and identify real hazards on the road.

This challenge is addressed by creating enhanced hazard warnings using vehicle data from a car manufacturer, historical accident information, and environmental data, including weather and traffic information.

Commitment to road safety extends to real-time insights provided to government agencies, empowering them to take preemptive precautions. A safer and more adaptive transportation ecosystem is paved by extracting actionable information from connected vehicle signals.

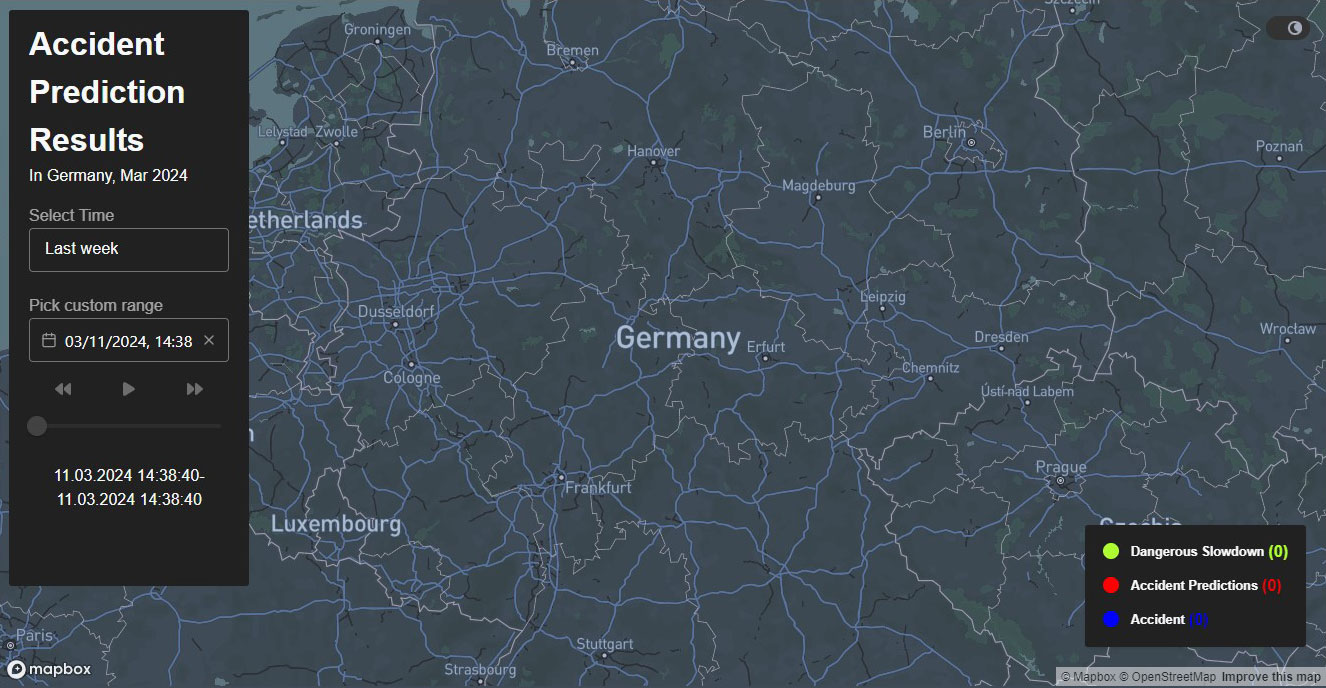
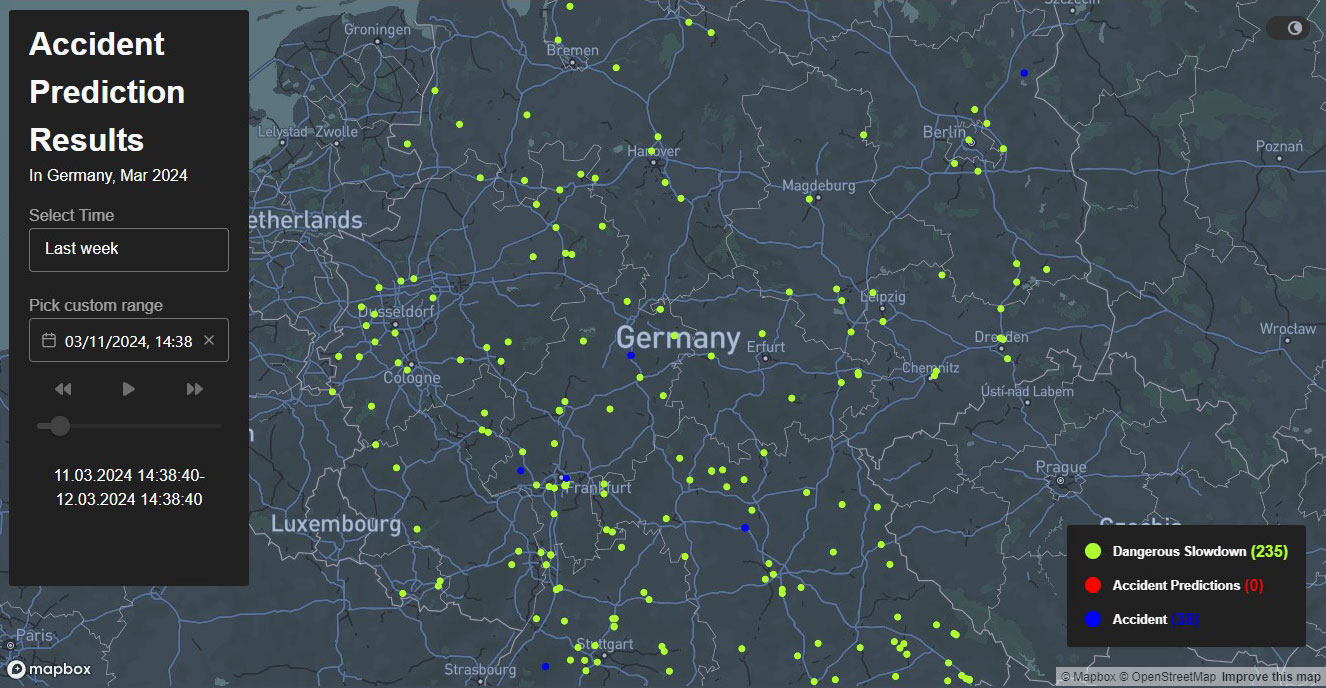
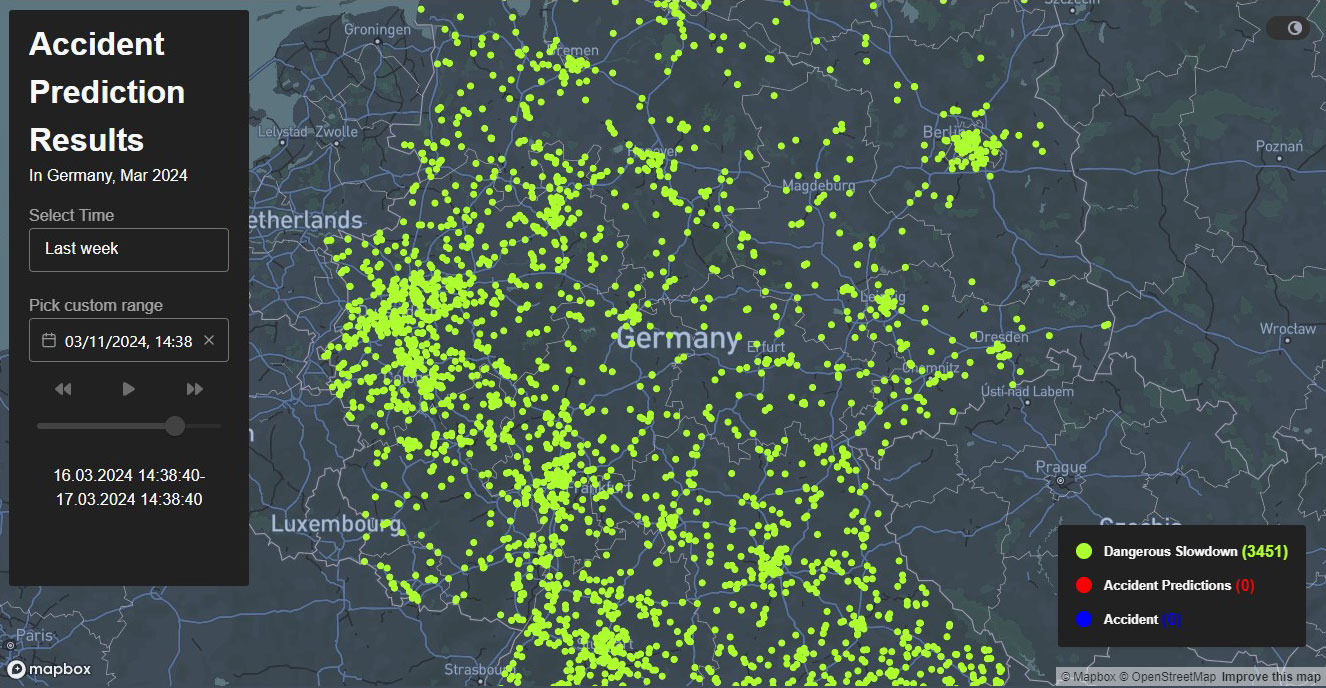
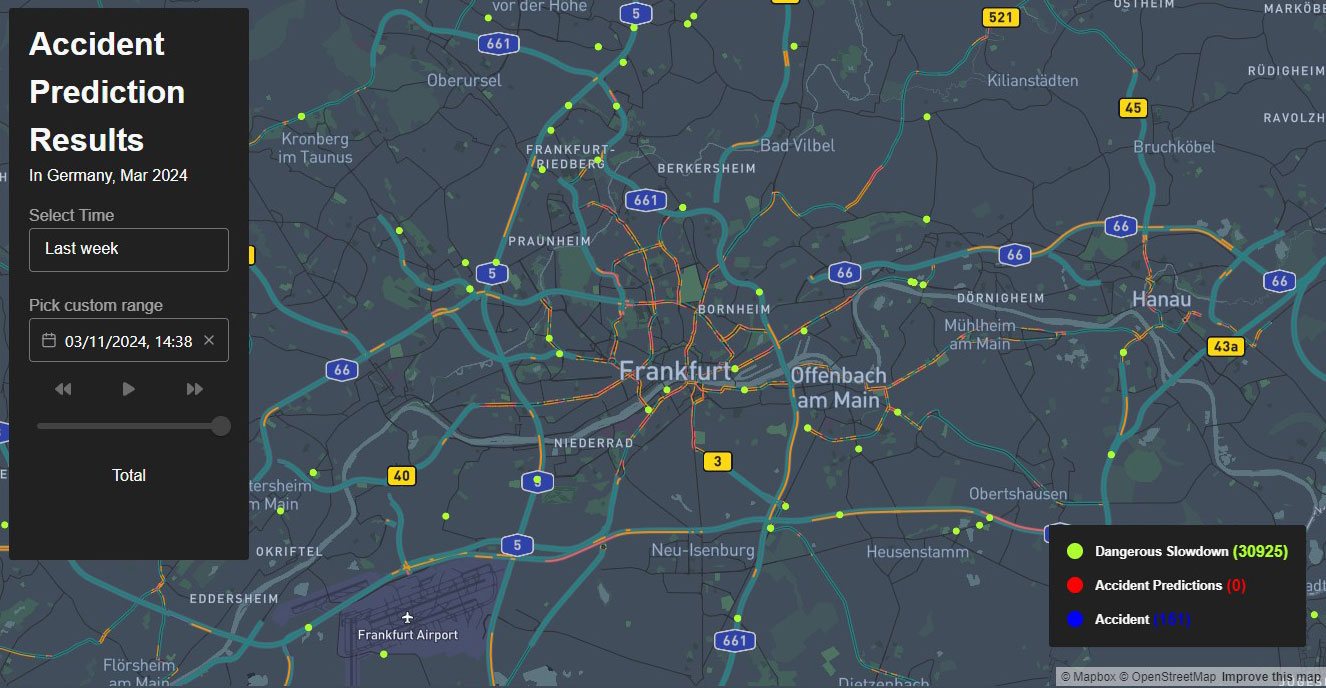
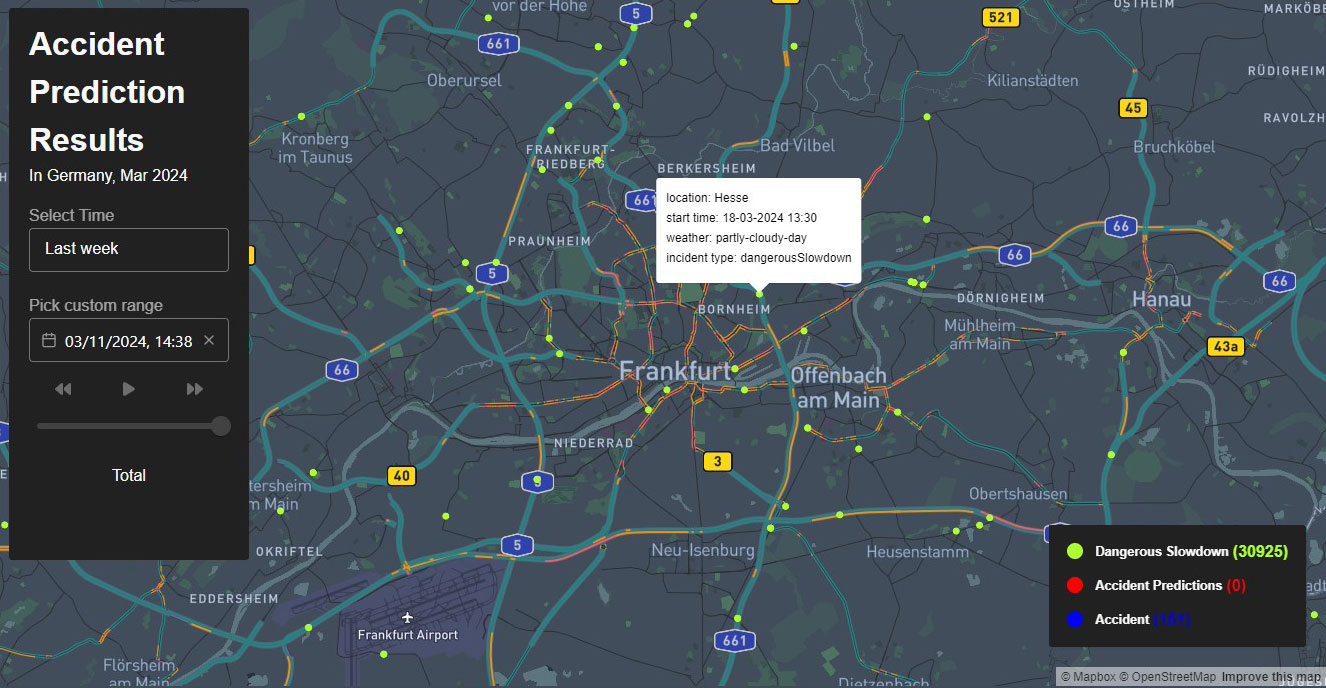
The image shows an animation of the web tool of the Mobias system Swarmnect. Here you can see several maps of Germany, which are shown in sequence. The view rotates and different coloured dots light up one after the other. The dots indicate traffic hazards (dangerous slowdowns, accidents, accident predictions). On the left-hand side of the screen, there is an information box where you can select a time period.The image shows an animation of the web tool of the Mobias system Swarmnect. Here you can see several maps of Germany, which are shown in sequence. The view rotates and different coloured dots light up one after the other. The dots indicate traffic hazards (dangerous slowdowns, accidents, accident predictions). On the left-hand side of the screen, there is an information box where you can select a time period.

Improved hazard warning through connected vehicle data: Swarmnect provides accurate insights into road safety over time and supports preventative measures.

Test it live now.
 

Data recipient: Mobias
Data provider: OEM

Mobias leverages connected vehicle data to support road safety with AI-based data processing platform, creating real-time road hazard predictions, actionable insights for preempitive precautions.

Voices from the project

„I am thrilled to integrate MDS data into our solution. Accessing comprehensive data sets from MDS partners add immense value to our analyses, enhancing our ability to make informed decisions and predictions. Collaborating with MDS has been a positive and efficient step forward for our product.“

Shared data:
Traffic information

Mobias captures vehicle data, historical accident information and environmental data, including weather and traffic information. This multi-layered data set provides a holistic view of the dynamic factors that influence road safety. Using advanced analytics and machine learning algorithms, these signals are carefully processed and analysed to identify valuable patterns and trends.